A QI measurement plan sets out what you will measure, how each measure is defined, who will collect the data and how the team will review it. It...
6 months ago
T charts are used when the error or undesired incident occurs infrequently in a particularly setting; for example, incidents of physical violence on wards, or incidents of falls. Because you need to maximise the number of data points on a chart in order to be able to see patterns in the variation (detect "special causes") you want to keep your intervals on the X-axis to short periods of time (e.g. days, weeks and fortnights). If an event is rare though, this means we can end up with too many zeros for the chart to be useful.
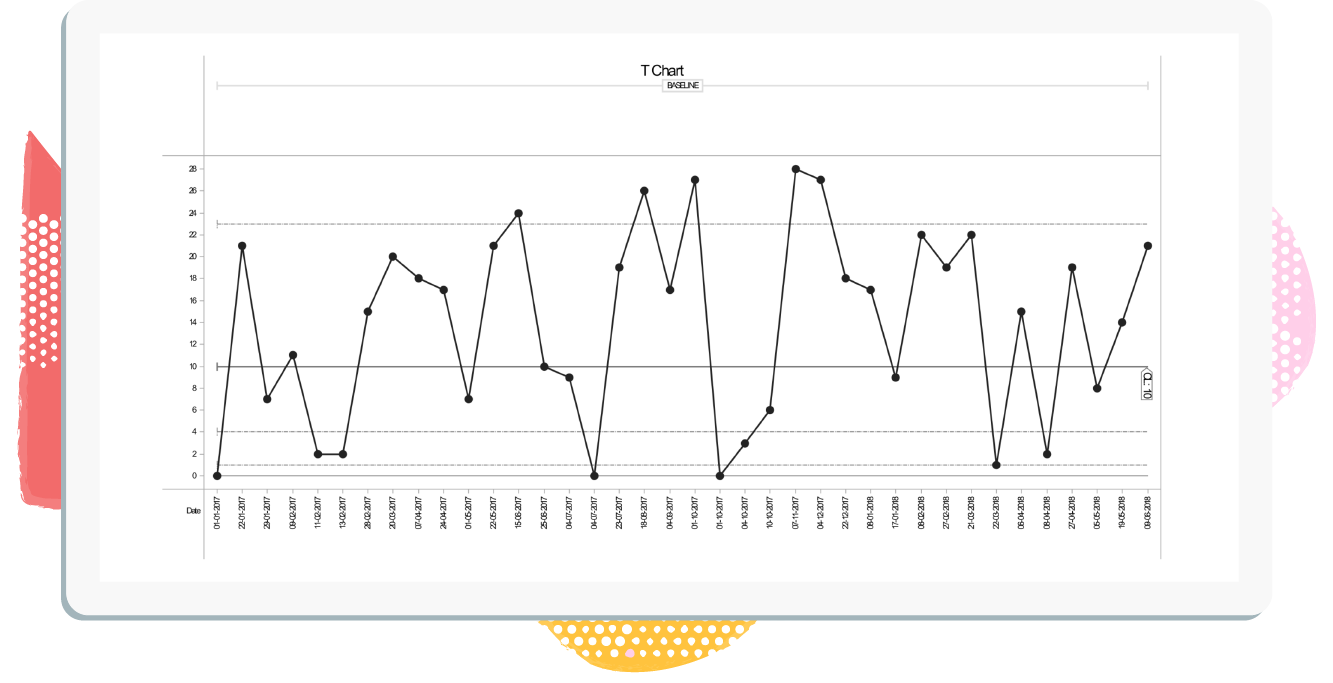
Using a T chart addresses this by instead charting the time between errors/incidents (usually the number of days between). For example, days between falls on a ward. Each point on the chart represents when a fall occurs. The height of the point shows the number of days between that fall and the previous fall. Note that using data in this way means "up is better" on the chart. Also the x-axis will not be consistent, because each point is the date of an incident.
Typical instances in healthcare would be:
- Days between infection outbreaks at a hospital
- Days between falls
- Days between incidents resulting in restraint
T Chart Example
Here we will show you what data is required when creating a T Chart and how this is reflected in the Chart itself.
So lets say the 'Aim' of the project was to reduce the rate of hospital acquired infections on Ward A in 6 months, and the measure was the number of days between infection outbreaks on Ward A.
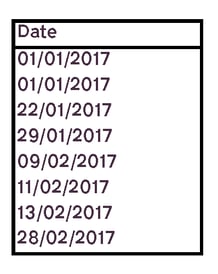
You would need to capture the following data:
| Event Date | Date the occurrence took place. |
| Value | Amount of time since between occurrences (e.g. number of days/weeks/months). |
Data Capture Example:
Number of days between infection outbreaks on Ward A.
T Control Chart Example:
Number of days between infection outbreaks on Ward A.