A QI measurement plan sets out what you will measure, how each measure is defined, who will collect the data and how the team will review it. It...
6 months ago
A Quick Overview of Run Charts
Run charts is very simple to construct and interpret. It does not allow for the same level of analysis offered by a control chart but can be used with almost any process and with any type of data: measurements, counts, percentages, ratios, and so on.
Typical instances in healthcare would be:
- Number of referrals
- Falls per 1000 occupied bed days
- Waiting times (Time taken between referral and first assessment)
Run Chart Example
Here we will show you what data is required when creating a Run Chart and how this is reflected in the Chart itself.
So lets say the 'Aim' of the project was to reduce the proportion of patients with hospital acquired pneumonia by 50% within 6 months, and the measure was the proportion of patients receiving daily preventative chest physio a day.
You would need to capture the following data:
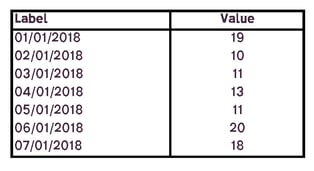
| Label | A label for each data point, for example the dates when the values were recorded. This data is plotted on the X axis of the chart. |
| Value | The measurements/counts/percentages you wish to plot |
Data Capture Example:
Proportion of patients receiving daily preventative chest physio a day
Run Control Chart Example:
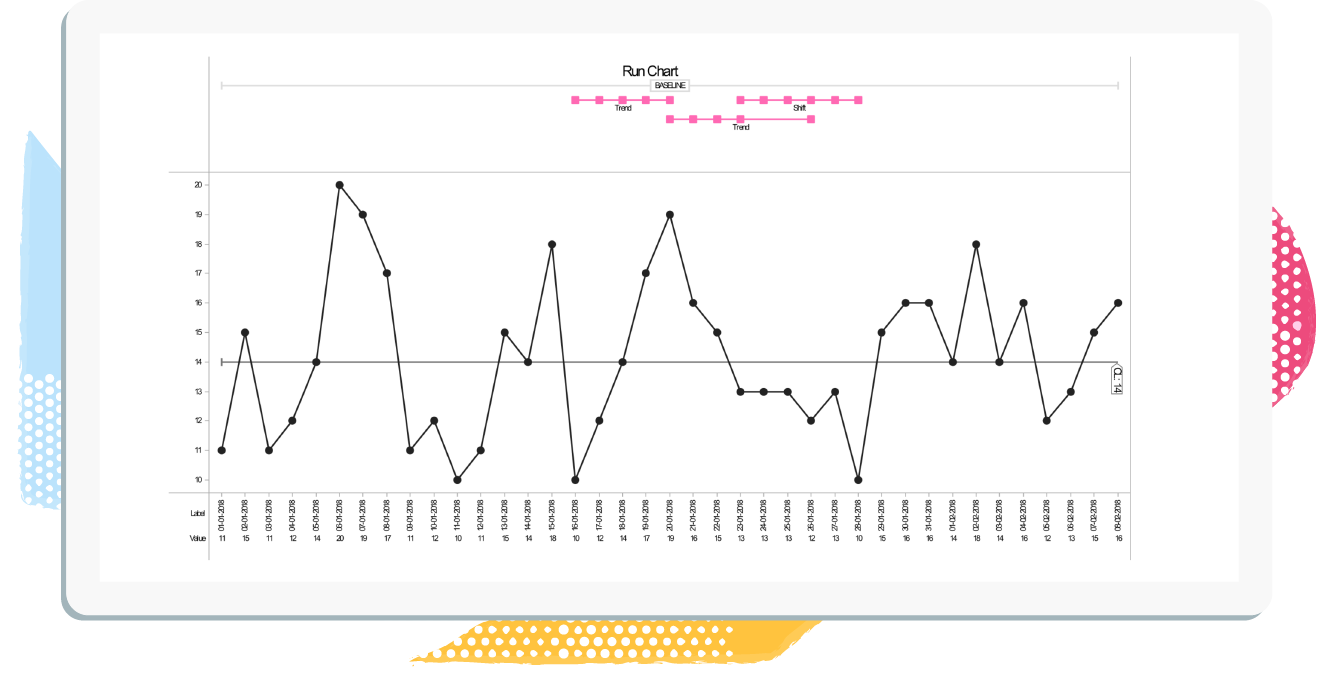
Proportion of patients receiving daily preventative chest physio a day