


A QI measurement plan sets out what you will measure, how each measure is defined, who will collect the data and how the team will review it. It...
6 months ago

P Charts display proportions or percentages, can have an equal or unequal sample size (also known as area of opportunity) and are the go to chart solution when the data is based on two classifications, for example: Yes/No, Pass/Fail, Meets/Doesn't meet a threshold.
Typical instances in healthcare would be:
- Percentage of Pressure Ulcers
- Percentage of Missed Doses
- Percentage "Did not Attends"
P Chart Example
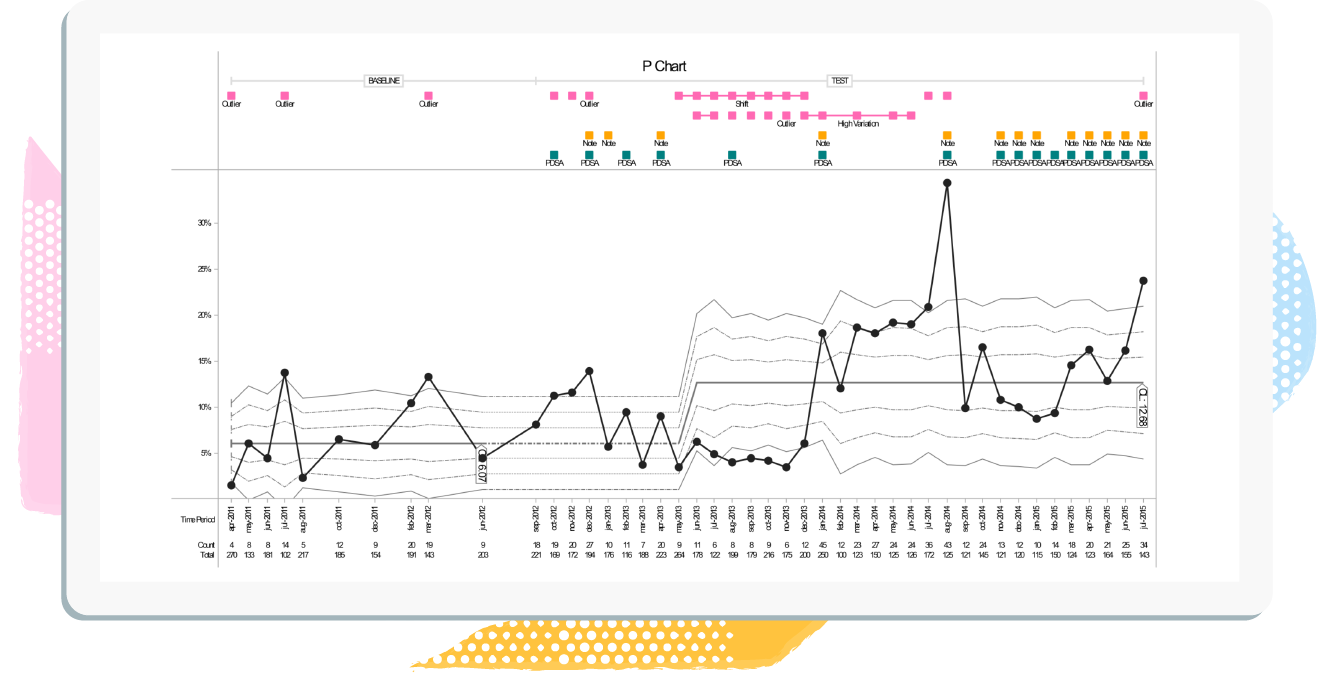
Here we will show you what data is required when creating a P Chart and how this is reflected in the Chart itself.
So lets say the 'Aim' of the project was to reduce the proportion of patients with pressure sores by 50% in six months on Ward A, and the measure was the proportion of patients taken out of bed 3 times a day on Ward A.
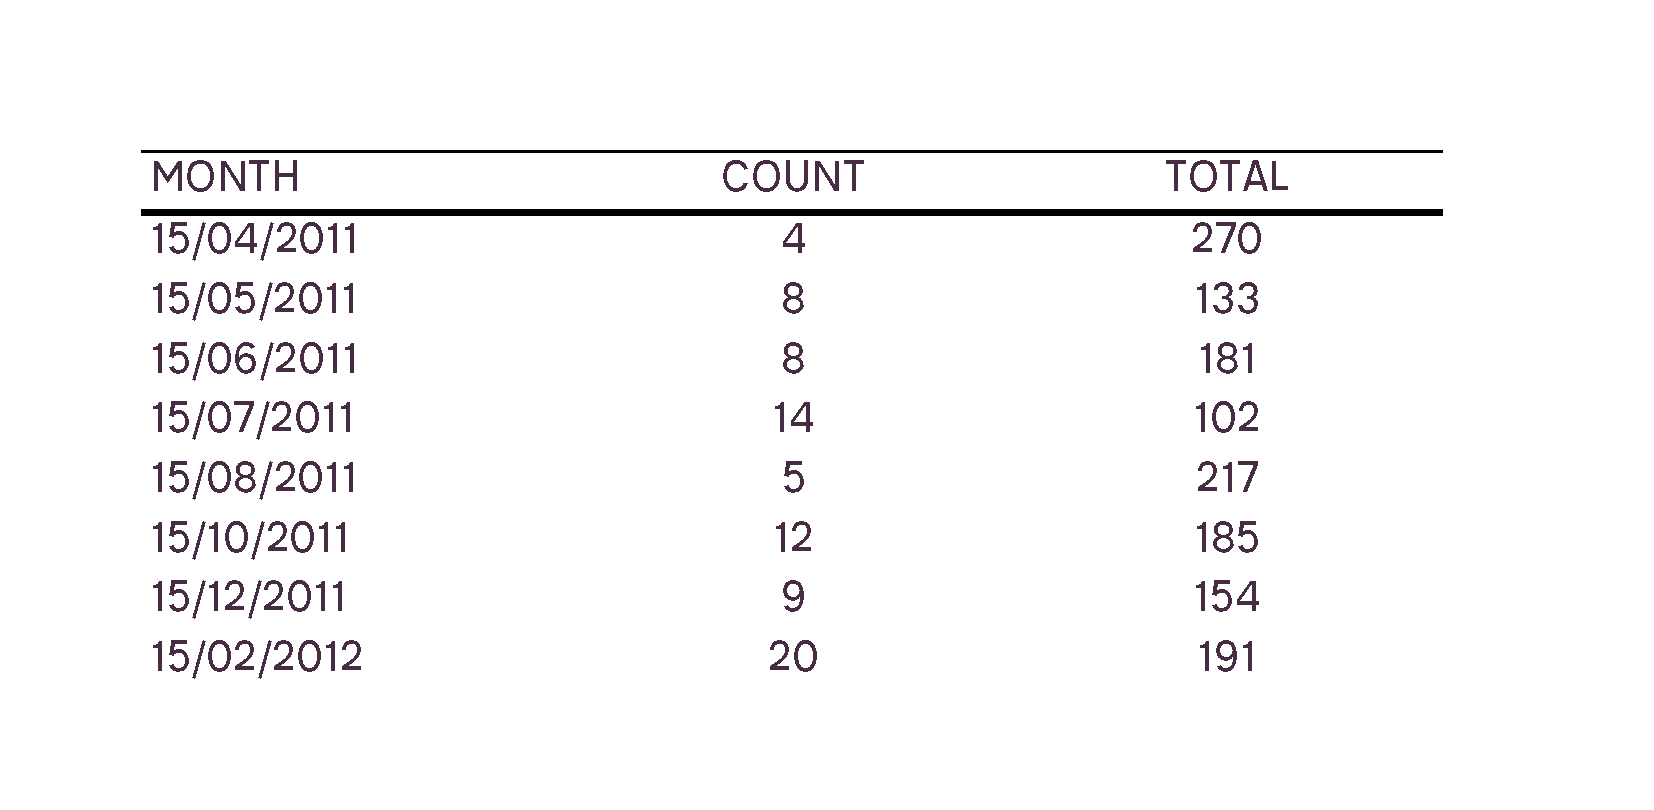
You would need to capture the following data:
| Time Period | Dates when the value was recorded (Daily, Weekly). |
| Count | The number of people that hit that criteria (3 times a day). |
| Total | Sample size each time the count was taken (No.of people on ward A at the point the count was taken). This is used to calculate the percentage and also to detect if the sample is of a consistent size or not. |
Data Capture Example:
Proportion of patients taken out of bed 3 times a day on Ward A
P Control Chart Example:
Proportion of patients taken out of bed 3 times a day on Ward A
If you want to learn more about SPC then take a look at our 'Everything you need to know about Statistical Process Control (SPC)' page.