


A QI measurement plan sets out what you will measure, how each measure is defined, who will collect the data and how the team will review it. It...
6 months ago

I charts are used for variable (continuous) data i.e. time, money, height/weight, temperature, workload/throughput/efficiency. It can also be used to record measures for each observed unit (e.g. individual weight per patient seen in a service). An I chart is not suitable for things you count (rather than measure); e.g. number of falls, incidents of violence, pressure ulcers.
Typical instances in healthcare would be:
- Waiting times (e.g. Time taken between referral to first assessment)
- Money (e.g. cost of successive admissions)
- Average Weight
- Blood Pressure
I Chart Example
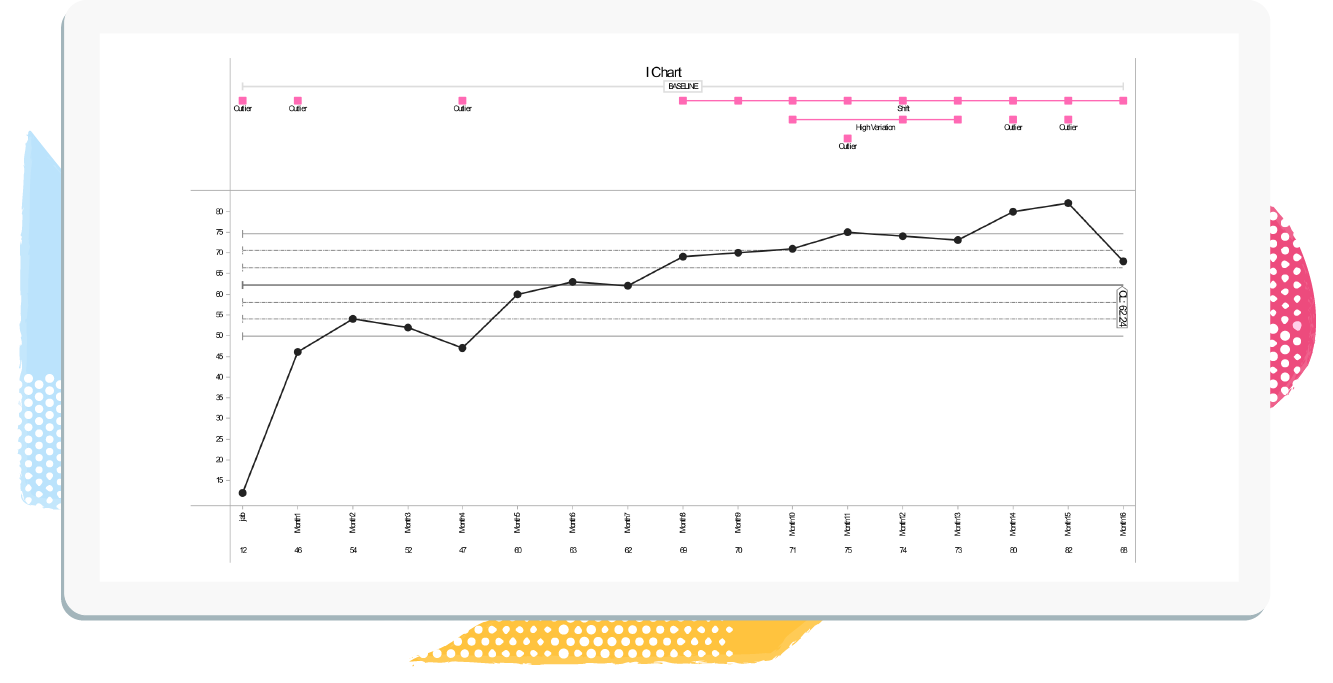
Here we will show you what data is required when creating an I Chart and how this is reflected in the Chart itself.
So lets say the 'Aim' of the project was to reduce the proportion of patients with pressure sores by 50% in six months, and the measure was the average length of hospital stay.
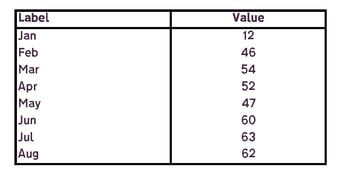
You would need to capture the following data:
| Time Period | Dates when the value was recorded (Daily, Weekly, Monthly). |
| Value | The measurements collected at every time period. |
Data Capture Example:
Average length of hospital stay
I Control Chart Example:
Average length of hospital stay
If you want to learn more about SPC then take a look at our 'Everything you need to know about Statistical Process Control (SPC)' page.